Interactive Load Shifting Tool
Electricity powers nearly everything we do, yet most of us rarely think about when we use it. Behind the scenes, demand rises and falls every hour, and the grid works constantly to keep supply in balance. What remains invisible to households are the timing, costs, and emissions, the factors that hold the key to making energy both cheaper and cleaner.
Imagine reducing your electricity bill and cutting CO₂ emissions simply by running your washing machine a few hours later. Take laundry as an example: shifting a wash cycle from the busy 6 pm slot to 3 pm not only leverages solar generation and lower costs but also lightens the evening demand on the grid. The result is real savings for households and a lighter footprint on the environment. When scaled across millions of homes, the collective impact becomes significant. The real challenge, however, lies in making these benefits visible, as most utilities and consumers rarely recognize just how much money and carbon can be saved by shifting demand.
To address this challenge, we developed a web-based tool that highlights the hidden value of flexibility. It illustrates the potential cost savings and CO₂ reductions from shifting energy use in clear, relatable terms. By presenting demand-side management through a simple, interactive experience, the tool makes it easier for both utilities and consumers to see the tangible impact of even small changes. You can explore the interactive demo here.
Building Blocks
We started by outlining the problem into its key elements:
- Load Profile represents the hourly electricity demand across a day.
- Flexibility Profile shows how much usage people can realistically shift up or down.
- Marginal Cost measures the cost of generating one more kilowatt-hour (kWh) in a given hour, depending on which power plant is operating.
- Marginal CO₂ represents the emissions produced when that additional kWh is generated.
With these foundations in place, we developed an algorithm to identify the exact times when shifting demand maximizes savings and emissions reduction for both households and utilities. The tool then turns this into clear, actionable guidance that shows users how to adjust their energy use for maximum benefit. And because speed matters, we optimized the calculations to update in real time within the browser.
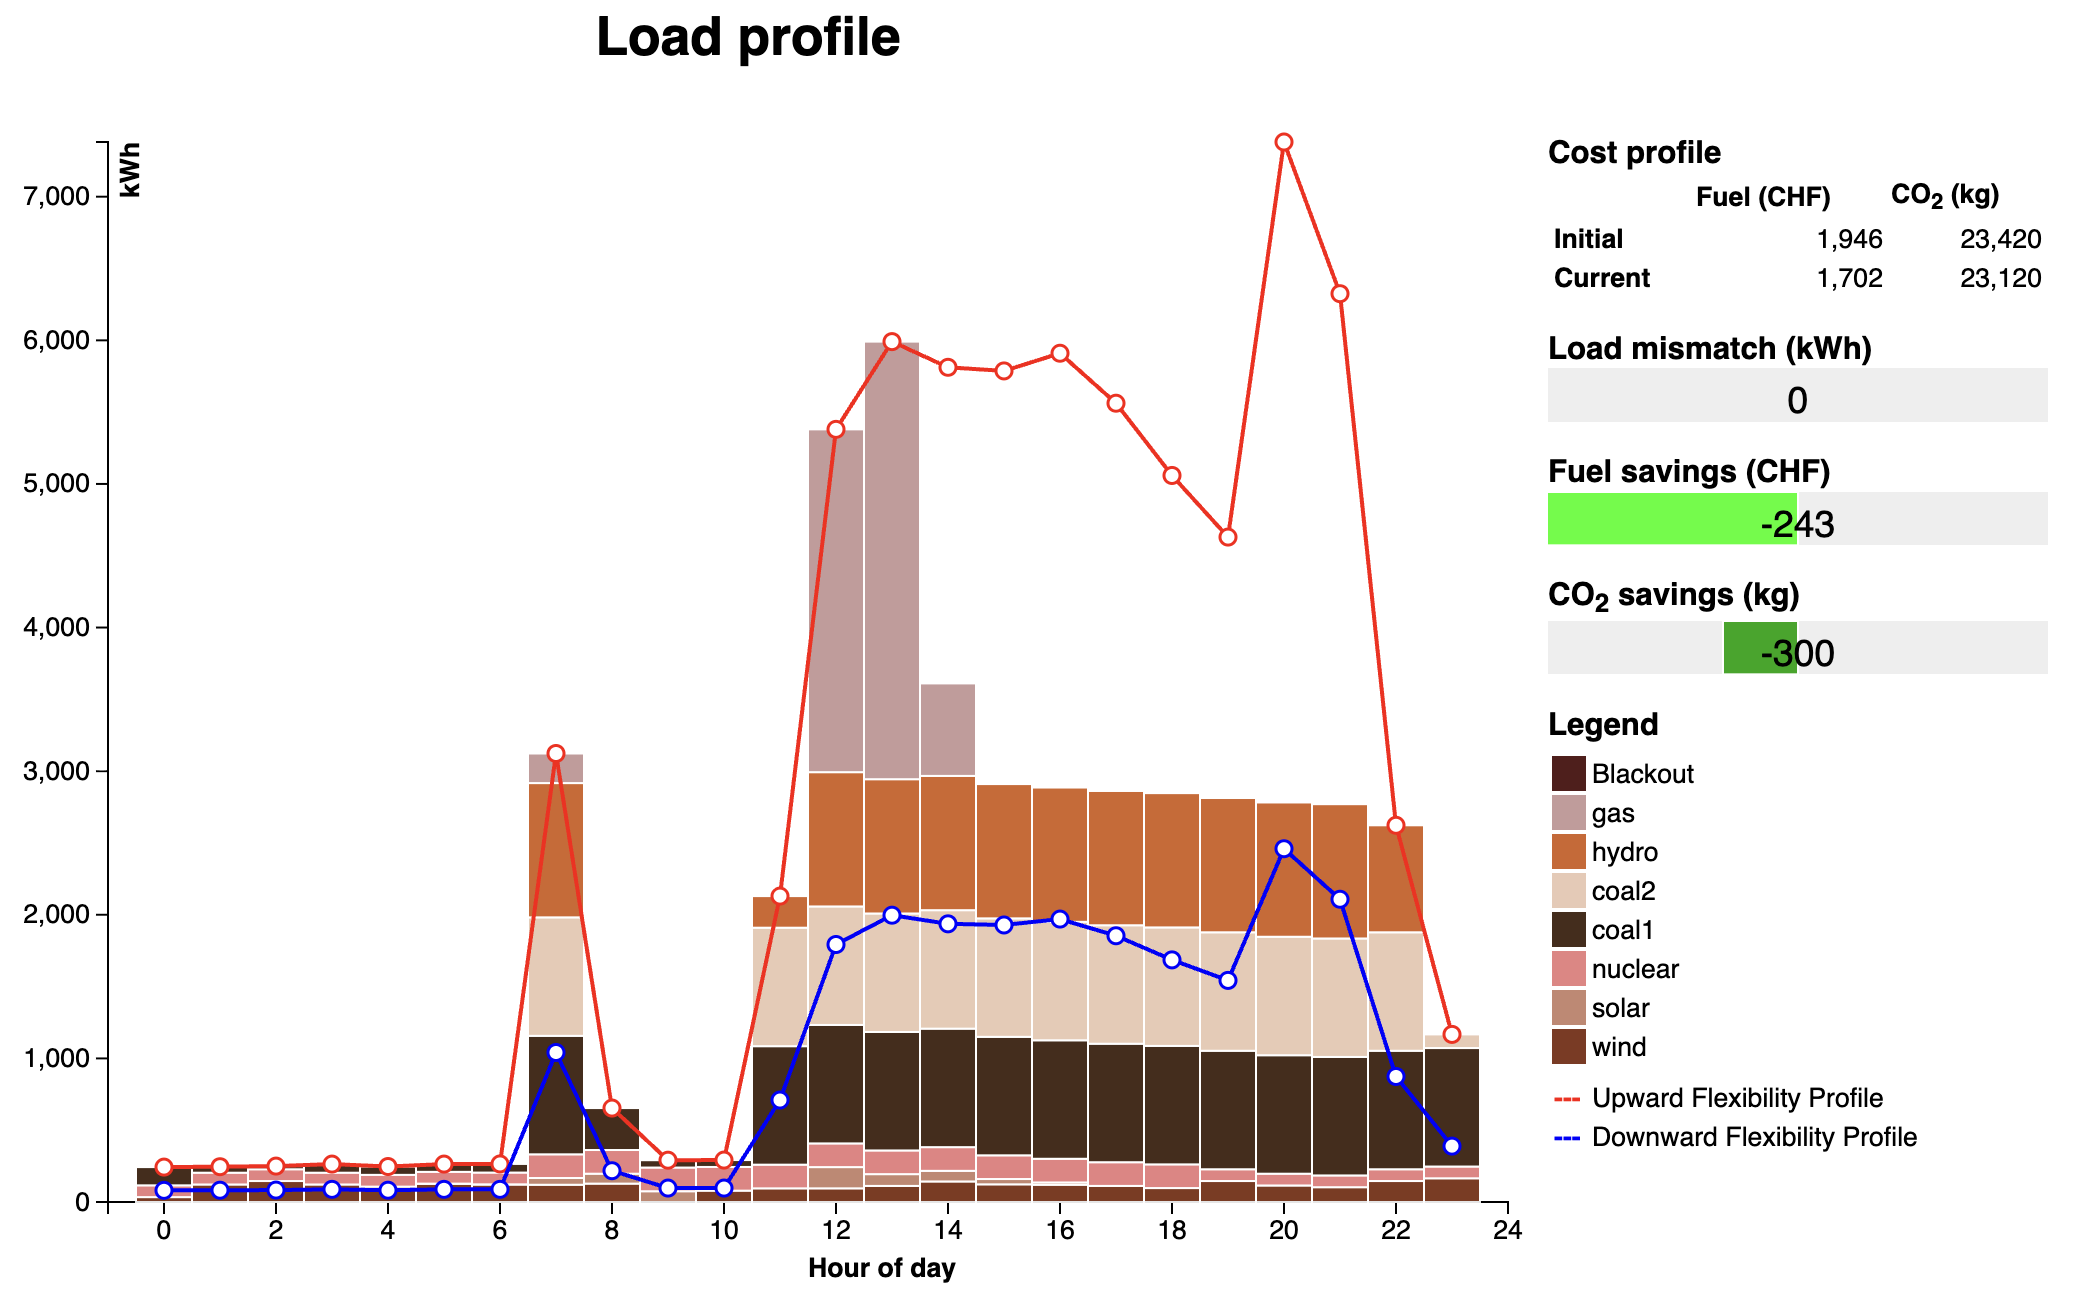
The interactive tool that shows cost savings from shifting energy demand.
Analogy
We can explain this problem with a brick-and-wall analogy. Imagine daily electricity demand as a wall made of 24 columns, one for each hour of the day. The height of each column represents the demand at that hour. Now, picture the wall being built from bricks, where each brick represents a distinct power plant. The size of a brick shows how much electricity (kWh) the plant generates. The color indicates the type of plant. The cost per unit size reflects the price of generation (cost per kWh). The weight represents the pollution it produces (CO₂ per kWh). The optimization problem becomes like a puzzle:
- How do we stack the bricks to fill the wall while staying within the minimum and maximum limits?
- Which bricks, and in what order, should go in first if we want the lowest cost or the lowest CO₂?
This framing makes the challenge intuitive. Instead of dealing with abstract equations, users can see the trade-offs play out in real time. This idea formed the foundation of our interactive shifting tool through a user-friendly interface, where users can adjust the load and flexibility profiles, set a priority (cost, CO₂, or both), and instantly see the optimized outcome after rearrangement.
Optimization
We designed a three-stage optimization process that can quickly and transparently compute the optimal allocation of demand.
-
Minimum requirements: First, fill each hour’s load with the mandatory minimum output, since every power plant must generate at least a base level and cannot simply be switched off.
-
Flexibility constraints: Next, allocate additional demand up to the lower limit of the flexibility profile for each hour, using the cheapest power plants available at that time.
-
Cost and CO₂ based allocation: Finally, distribute the remaining demand across the most cost-effective plant.
We implemented this entirely in JavaScript, allowing the tool to run directly in the browser. We developed a simple interface for users to input load profiles, flexibility profiles, and cost parameters. Users can choose to optimize for cost, CO₂ reduction, or a weighted balance of both. The optimization results update in real time based on their choices.
Reflections
The Energy Shifting tool turned out to be more than just a coding project. It made complex energy concepts such as demand flexibility and management simple, tangible, and actionable. The interactivity allowed users to grasp flexibility and value more easily than through spreadsheets or equations. Most importantly, the project showed that meaningful impact doesn’t always require massive infrastructure. Sometimes, a simple, well-designed tool is enough to change perspectives and encourage smarter, greener energy choices.
Small shifts in energy use can yield significant savings and substantial environmental benefits.