Monitoring Control Infrasturcuture at CERN
When thousands of devices power the world’s largest experiments, even a single failure can ripple across the system. At CERN, the smooth operation of accelerators and experiments relies on the control infrastructure, which comprises thousands of technical devices working in unison. These include programmable logic controllers (PLCs), which run industrial control logic, power supplies that feed magnets and detectors, and front-end modules that manage communication between equipment and higher-level systems.
These components come from vendors such as Siemens, Schneider, and Beckhoff. Each vendor, however, provides its own method for reporting status and error messages, resulting in a fragmented monitoring landscape. Until recently, operators could only view device health through flat dashboards, i.e., long tables or grids with thousands of entries. While these displays showed the state of each device individually, they did not convey the hierarchy or the relationships between devices. As a result, operators had to manually scan long lists to detect issues. When a device failed, it was not immediately clear how that fault affected the larger subsystem to which it belonged.
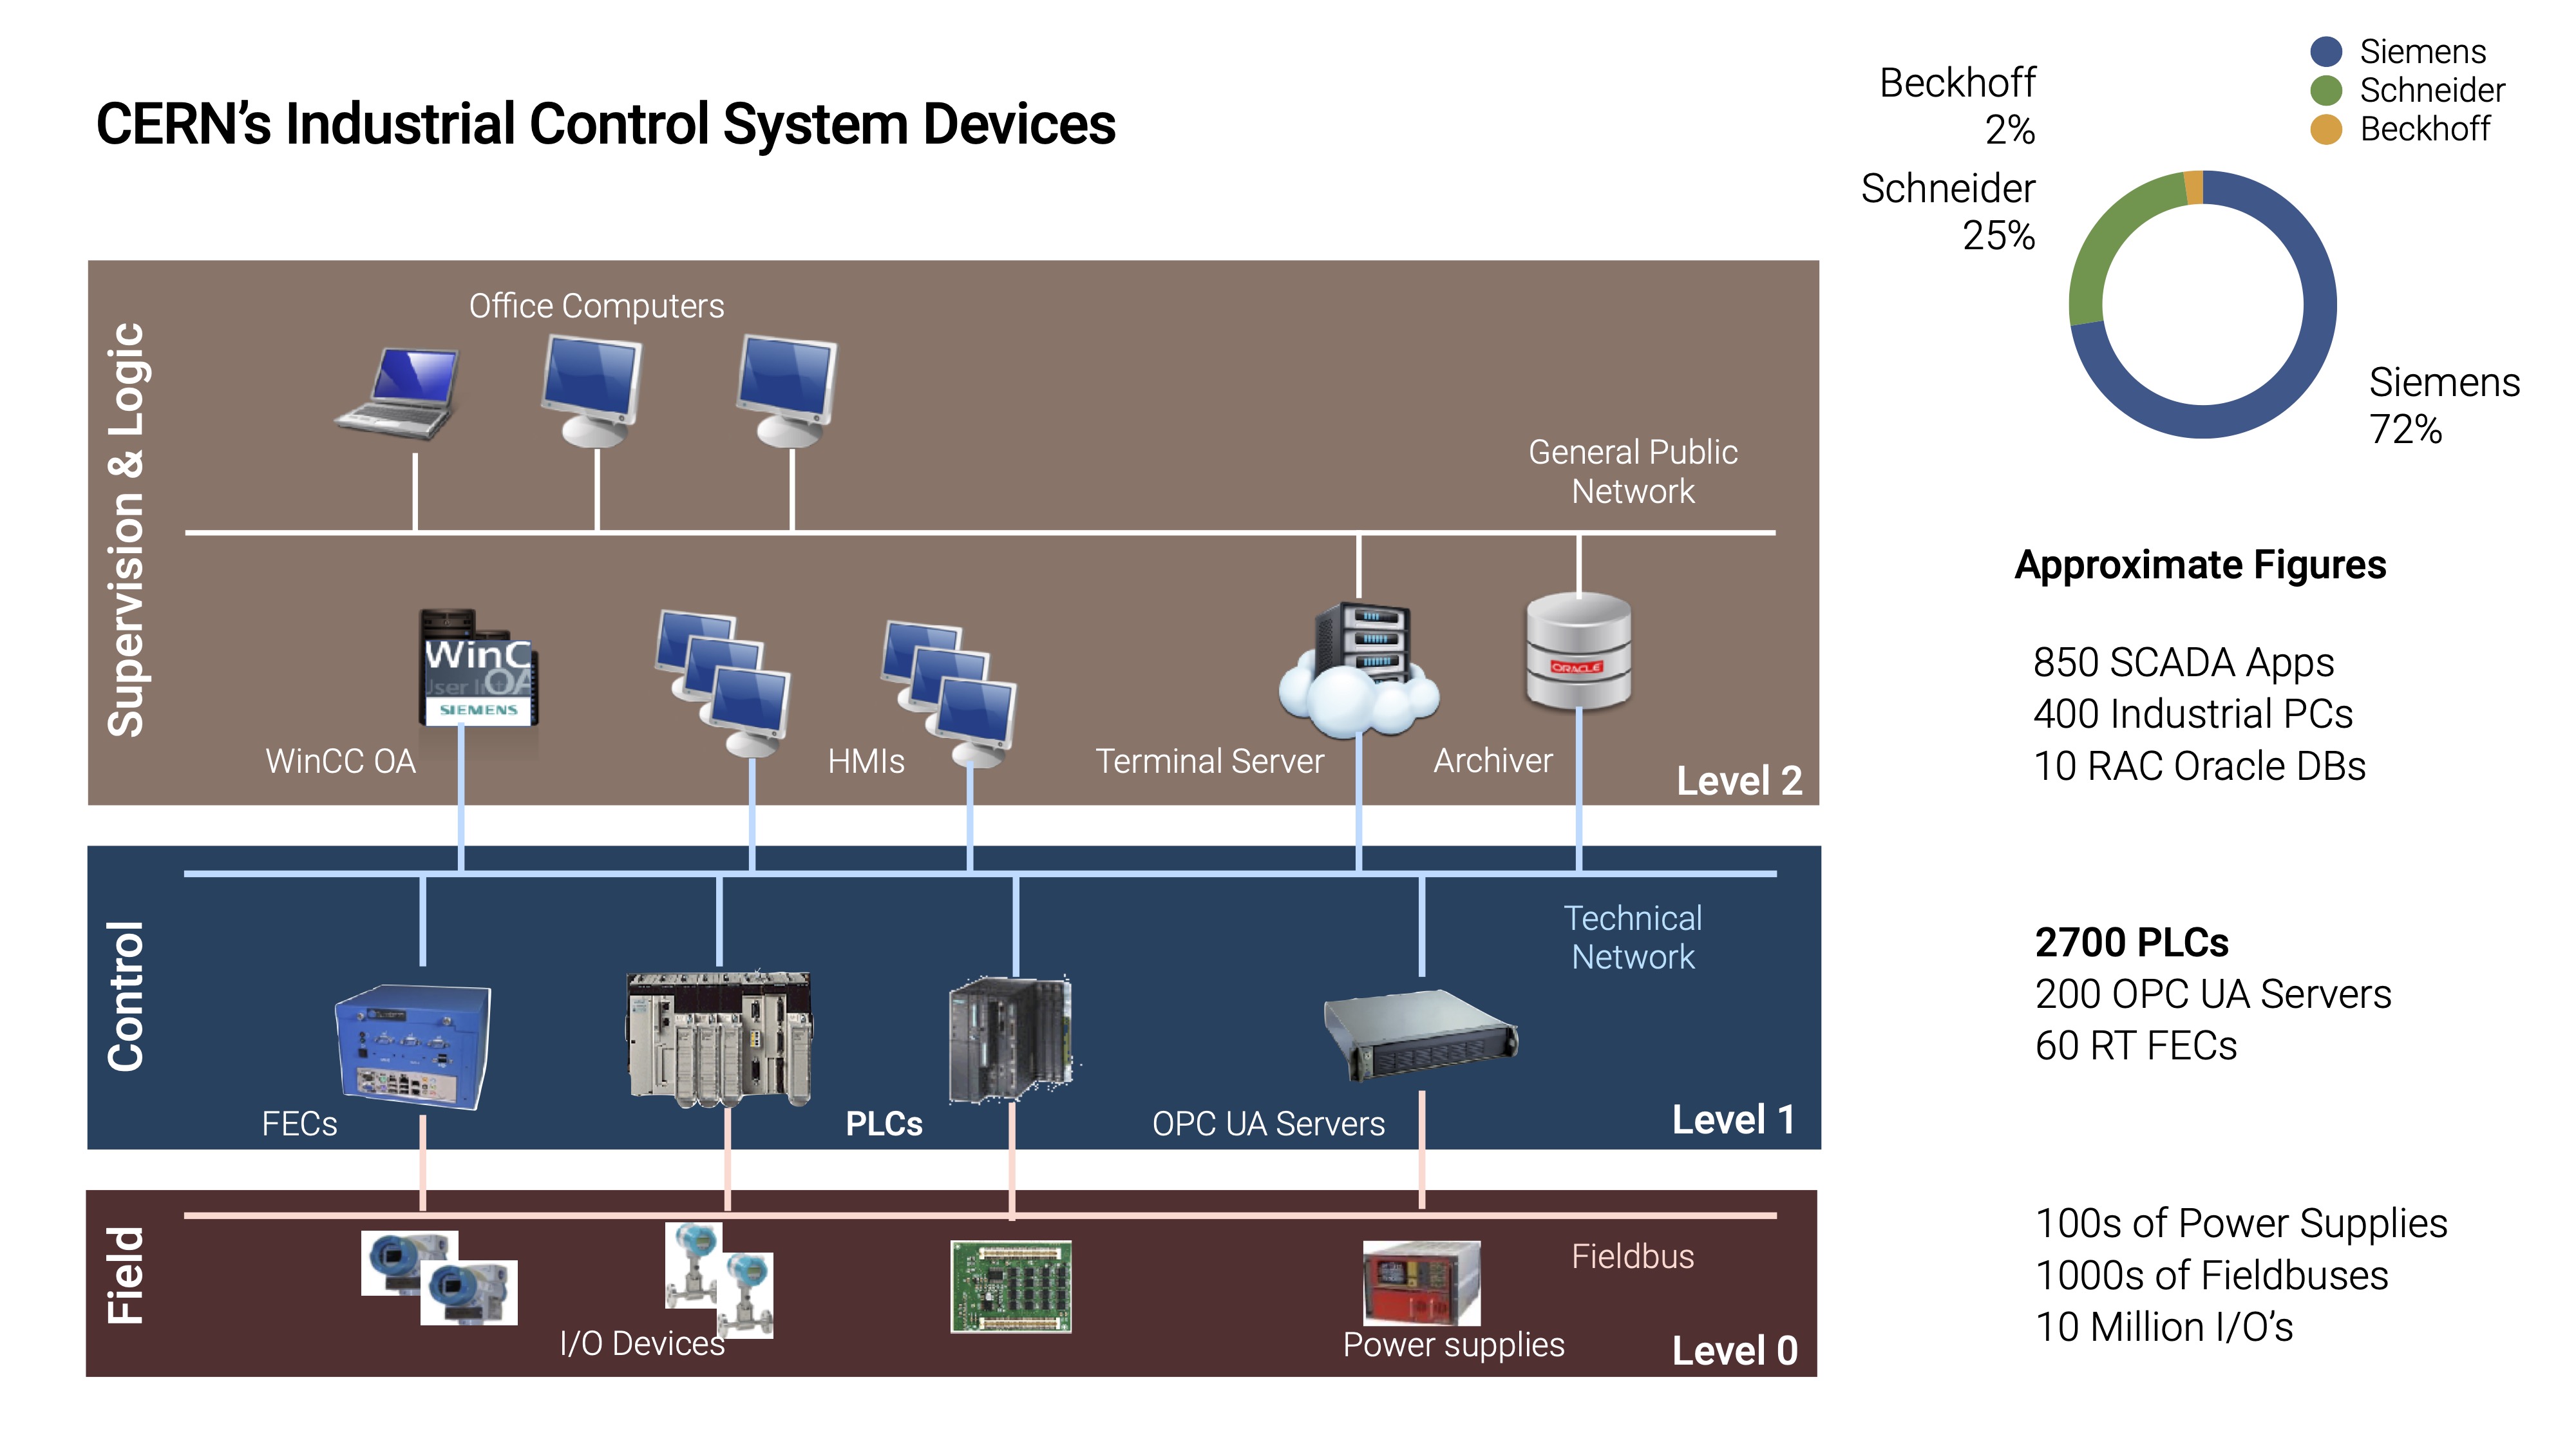
Devices comprising CERN’s industrial control infrastructure
Structured Monitoring
To overcome the limitations of flat dashboards, I led the design of a web-based monitoring platform with the following capabilities:
- Organized tree structure: Devices can be arranged in a hierarchy that mirrors CERN systems (e.g., device → subsystem → sector → accelerator).
- Rule-based health status: Users can define logical rules for groups, such as “if any child device has an error, the parent node turns red.”
- Error propagation: Faults cascade upward in the tree, allowing operators to see high-level health at a glance and then drill down to the specific device.
- Scalable views: The tree can be expanded or collapsed, allowing operators to start with a broad overview and zoom in only where necessary.
The platform supports multiple modes of operation. In Design Mode, users can build or edit the tree, assign devices, and define the logical rules through a web interface. In Deploy Mode, the configuration of devices and rules is exported and pushed to the back-end system. In Monitor Mode, operators view the live device tree, with colors indicating status.
Beyond these core modes, the platform also supports Customization. Tree structures and device configurations can be imported or exported via JSON files, and users can define how device or group states are mapped to specific colors. This flexibility allows the system to adapt to different use cases and operator preferences.
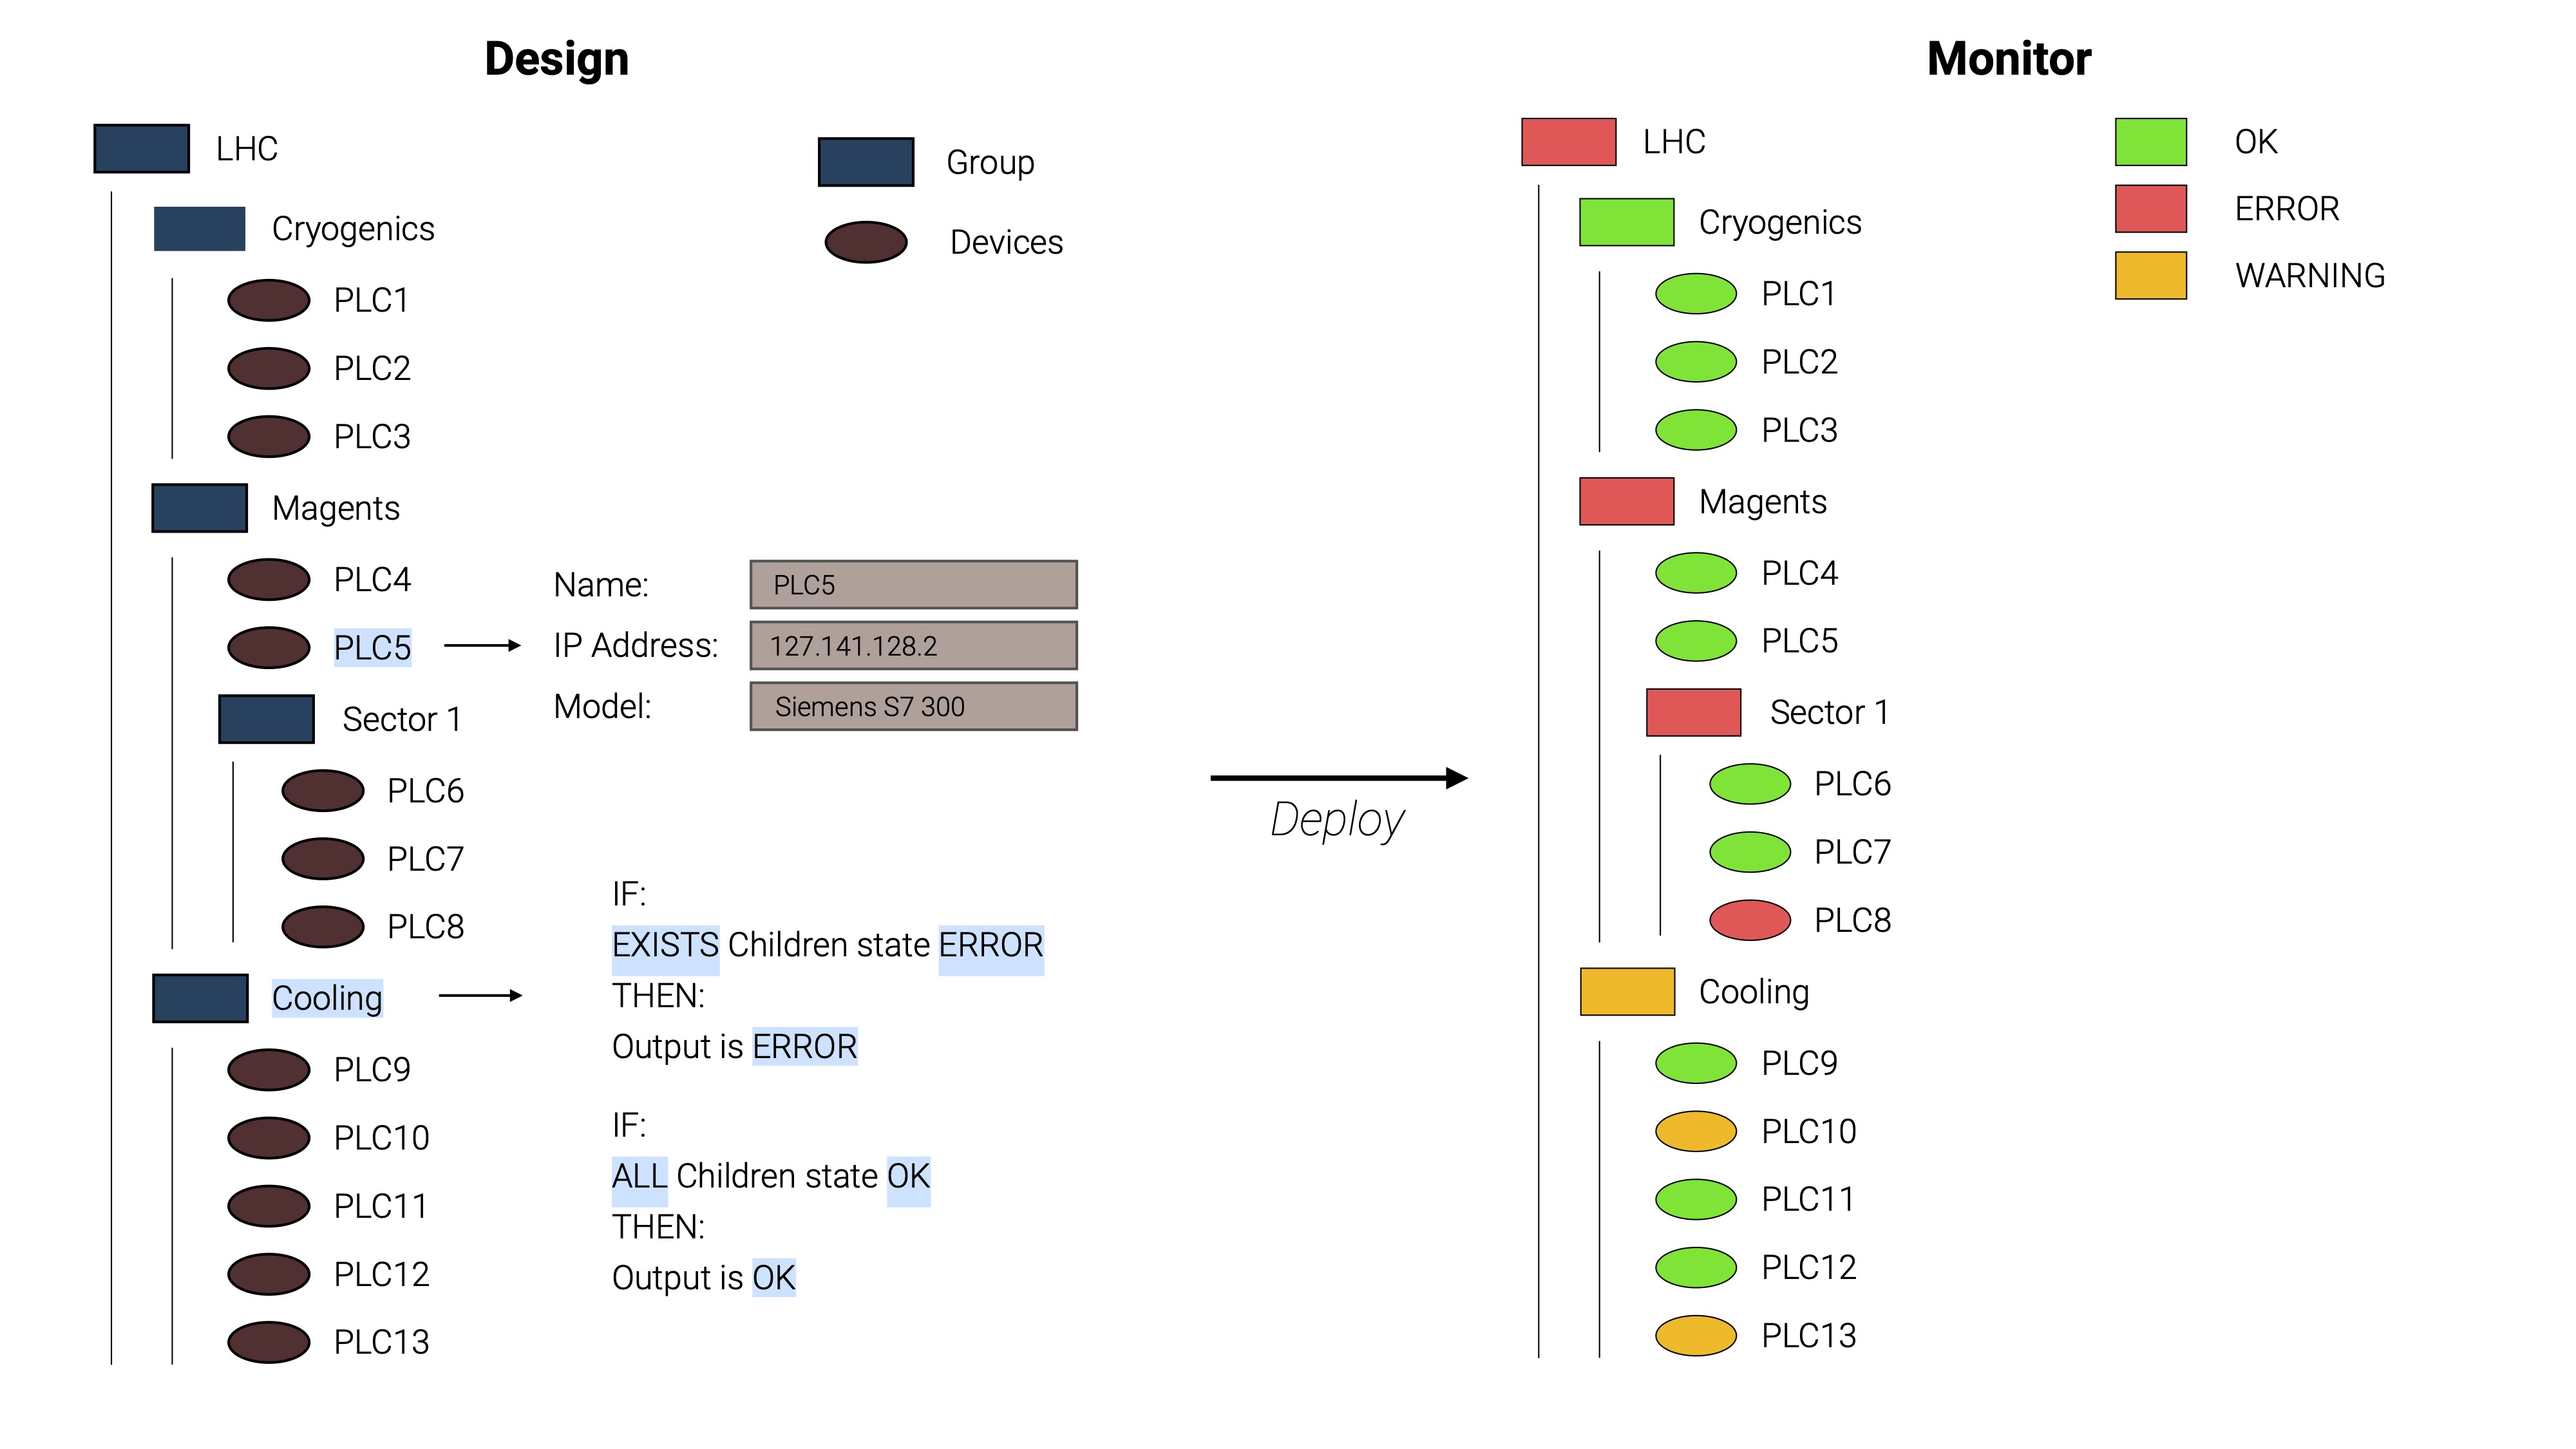
Hierarchical device view mirroring CERN systems, with group-level rules
Insights
The monitoring platform offers a way to explore more effective device health tracking at CERN. Instead of scanning thousands of devices individually, operators can now rely on a single top-level node to signal problems and guide further investigation. Customizable rules enable the system to adapt to various use cases. While we developed the platform for CERN’s control devices, the same approach can be applied to any large industrial environment where device health must be tracked across layers. The platform also lays the groundwork for advanced analytics and predictive diagnostics, enabling organizations to shift from reactive monitoring to proactive maintenance.
Architecture
Here’s a brief overview of the monitoring platform’s architecture:
- Frontend (Web UI)
- Framework: React.
- State Management: Evaluated Redux, Zustand, and Jotai → chose Jotai because it naturally fits tree-like structures.
- Tree Rendering: Each node has its own state; React components recursively render the hierarchy.
- Rule Editor: Simple UI for creating logical rules (e.g., AND/OR, “at least N devices must be healthy”).
- Persistence: Uses browser local storage, so work is not lost between sessions.
- Backend
- Language: Go (chosen for its simplicity and efficient concurrency).
- Responsibilities:
- Maintains the device tree.
- Collects child states, applies rules, and propagates results upward.
- Interfaces with existing diagnostic tools that query real devices.
- Logic Engine: Built in OCaml, supports expressive logical rules beyond simple AND/OR.
  graph TD
  subgraph FE["Frontend (Web UI)"]
    R[React UI]
    J[Jotai State Mgmt]
    T[Tree Rendering]
    RE[Tree & Rule Editor]
    LS[(Local Storage)]
    R --> J
    R --> T
    R --> RE
    R --- LS
  end

  subgraph BE["Backend ()"]
    G[Go Backend]
    DT[Tree Propagation Logic]
    DIAG[Diagnostic Drivers]
    OC["Logic Engine (OCaml)"]
    G --> DT
    G --> DIAG
    G --> OC
  end

  FE -- "Configs / Rules" --> BE
  BE -- "Monitoring Data" --> FE